Last contentful paint (LCP) is a big pain-point for Shopify app developers seeking the Built for Shopify (BFS) badge. There’s a lot of different factors that can slow you down, it depends on real-world performance, and there’s a delay before you see the metrics. This makes it hard to iterate quickly and it can take a long time to identify and fix issues.
One of our apps, the Ablestar Link Manager, is Built for Shopify. In this post we’ll cover a bunch of different areas that we looked at while improving our LCP.
Things to Check
LCP measures the time from when a user navigates to a page to when the largest text or image block is visible. Broadly speaking, there’s three steps here that we need to examine:
- Initial page load - the first HTML page that’s loaded into the Shopify Admin
- Loading static assets - retrieving the Javascript and CSS files for your app
- AJAX requests - any additional requests made before the content is shown
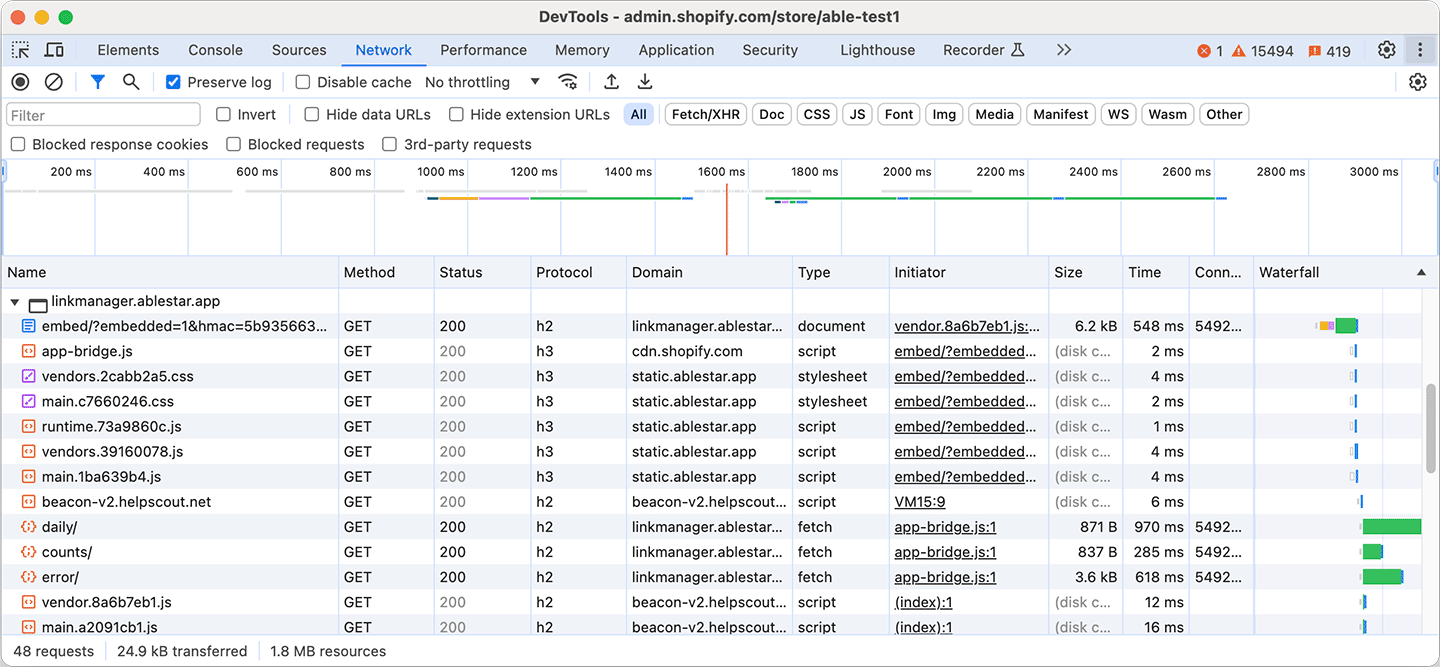
How do you know what to focus on first? The easiest way is to use the Network tab of Chrome’s developer tools. This will show you the time it takes for all three steps to process. Look at the timings for the different requests and see if any particular step stands out.

Initial Page Load
When Shopify loads your embedded app the first step is to request an HTML page from your web server. Until this page loads in the browser nothing else can happen.
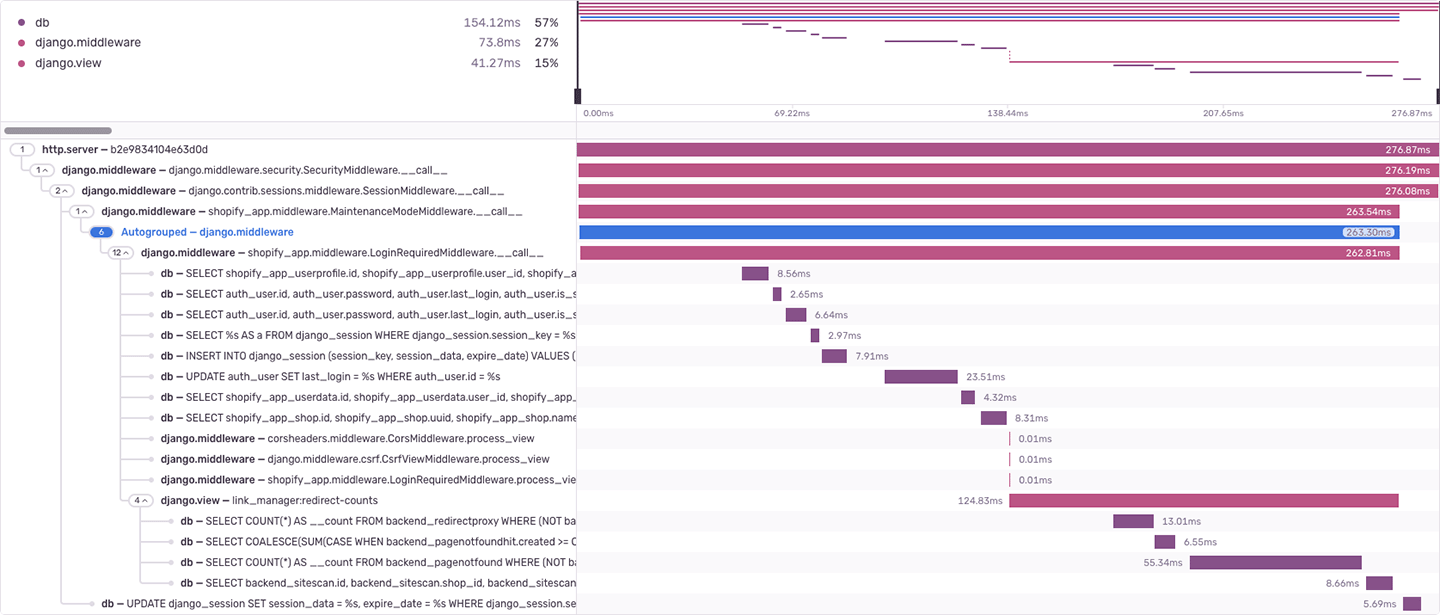
We use Sentry for profiling HTTP requests to the backend. This shows which parts of processing an HTTP request are slowing us down the most. Initially we set up Sentry to profile every HTTP request but then you can tune it so it only processes a certain percentage of requests.

When you look at requests in Sentry you’ll see different database queries or secondary HTTP requests that are taking a long time. In our app we identified three things we could optimize.
Identify and fix slow database queries
For both the initial page load and the followup AJAX requests, slow database queries are a common chokepoint. Oftentimes it’s not slow when you develop or first launch the app, but then once your tables start to grow things will start to slow down.
Database table denormalization
A full treatise on database query optimization is beyond the scope of this post but one thing that helped us is denormalizing some of our data. This means that you include some precomputed data in your tables, even if you could get that data with another query.
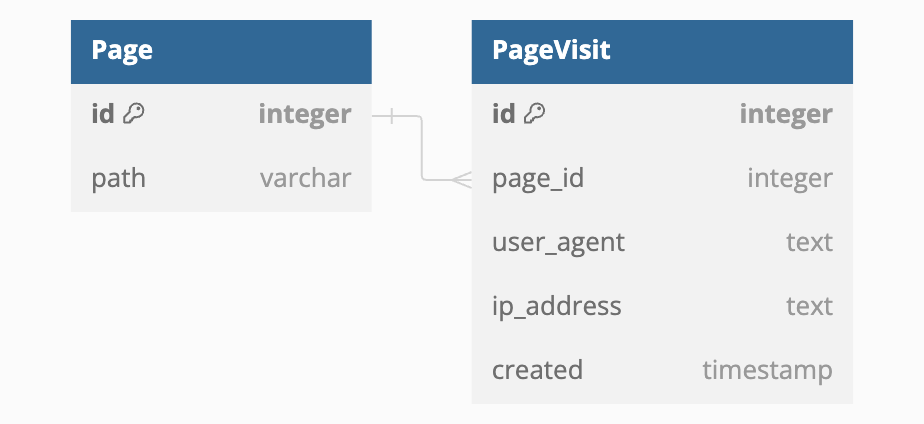
For example, if you’re tracking visits to a URL you could have a Page table with information about the URL and a PageVisit table that tracks each visit to that page. A simplified example would look like this:

If you wanted to show all the pages along with when they were visited you could do something like:
SELECT
    path,
    count(*) as visit_count,
    min(created) as first_seen,
    max(created) as last_seen
FROM Page
LEFT JOIN PageVisit ON PageVisit.page_id=Page.id
GROUP BY path
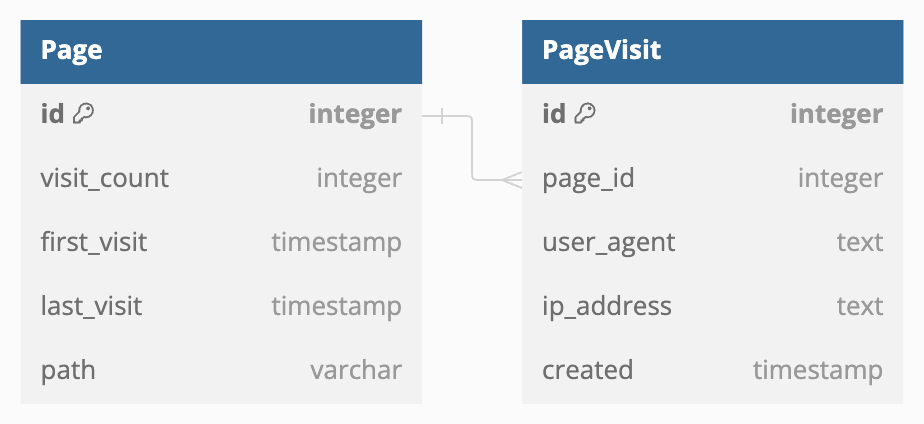
This works fine if you don’t have too much data but as tables grow the JOIN and GROUP BY could become more expensive. One way to speed up the query would be to store the total visit count on the Page table:

This way you just need a simple SELECT statement to view all the information:
SELECT path, visit_count, first_seen, last_seen FROM Page
To do this you would need to also increment the values in the Page table when you’re writing a new PageHit record. There means more overhead when writing to the database but loading the data will be faster.
Decrease the number of database queries
Even if an individual database query doesn’t take that long, the cumulative time of lots of short queries can slow things down. If you need to request multiple rows from a single table, it’s better to do it with one query.
When optimizing the Link Manager we found three places where we could remove queries:
- There were queries for data we actually didn’t need
- We needed data eventually, but it could be loaded in a followup AJAX request
- We were querying same table multiple times and these could be combined into a single query
We used Sentry to identify these extra queries and were able to save ~100ms by removing them.
Decreasing inline HTTP requests
Ablestar Link Manager uses Shopify’s new managed installation flow. This is a huge improvement as you don’t need to worry about multiple HTTP OAUTH redirects when you load the app. Instead, you receive a token in the URL when Shopify requests the page and you can exchange that for an online and/or offline access token.
When we first deployed this we made a mistake and performed the offline token exchange each time the page was loaded. This added 300-400 ms to each request and slowed things down noticeably.
Now we only perform the exchange if we don’t have a valid token and things have sped up considerably.
Running actions in the background
When the web server is preparing the initial HTML page it should only be doing things that are essential for the page to load. If you need to perform additional actions, like sending the user a welcome email, process that task in a background with something like Sidekiq (Ruby) or Celery (Python). This way a slow API call won’t delay the loading of the page for the user.
When a user first installs our app we have a background task that runs which will take care of these secondary tasks. It usually completes in a second or two but now that work isn’t delaying the app from loading.
Loading Static Assets
After the browser has the HTML for the embedded app it will request the Javascript and CSS files that are referenced in the HTML. To get the files to load faster we can use a CDN, split them up, and improve their caching.
Use a CDN
Your Javascript and CSS files shouldn’t be hosted on the same server as your web application. Instead, use a service like AWS Cloudfront or Google Cloud’s CDN to host these. There’s several advantages to this:
- Your files are stored in datacenters around the world which are closer to your users and will load faster
- They’re optimized for speed and it’s easier to take advantage of things like compression and HTTP/3
- Requests for your static assets won’t block other HTTP requests to your main app
The one exception to this is if your whole application is being Cloudflare, in this case they should automatically cache and serve the static files through their CDN, but double-check your settings to be sure.
Split static assets
If you’re building a standard Single Page Application in Javascript you’ll probably have two static files for your assets:
- main.css
- main.js
main.css will include the CSS for your application (and the Polaris components) and main.js will have all the Javascript. When a user loads your app the browser will download both files and then cache them for subsequent requests. These files can be fairly large because they include all your app’s dependencies.
Browsers will cache these files (more on this later) but there will be a problem when you deploy a new version of your app. If you just change one line, main.js will be different and the whole file will need to be downloaded again.
The solution to this is to split your static files into two parts, a main which contains your application’s code and a vendors file which contains the packages you’re using.
For the Javascript file, vendors.js will contain different Javascript packages like the Polaris components which are rarely updated. main.js will be much smaller and includes your application’s code. Then, when you deploy a new version of the app a returning user will just need to download the updated main.js.
Include hashes in static filenames
Taking the above optimizations one step further, you can configure Webpack (or your equivalent) to include hashes for files in their filenames. This means that instead of having a file named main.js you would have something like main.3916ea78.js.
The hashes in the filenames will only change when the content of the filenames changes. This means that you can be sure that the contents of the file main.3916ea78.js will always be the same. We can use this to improve caching which we’ll discuss next.
Improve the Cache-Control header
When a web server or CDN serves your CSS or Javascript files it will include the Cache-Control HTTP header. This header instructs the browser on how it should cache the file.
If you’re using hashes in your filenames you want the browser to store the file as long as possible since you can be sure the contents will never change. If you were to update your code, your HTML would refer to a different filename because the hash of the file would be different.
The static files for our Link Manager app have the following HTTP header set:
Cache-Control: max-age=2592000, immutable
The max-age specifies how long the browser should cache the resource in seconds. In our example it’s 30 days (30 * 24 * 60 * 60) but you could probably do longer.
The immutable key means that the file will never change (since we have hashes in the filename). This prevents the browser from having to check with the CDN to see if there’s a newer version of the file available. This can significantly speed up the load times for repeat visitors to your app.
Use defer for Javascript files
When you load your Javascript files add the defer attribute for your <script> tags. This allows the browser to download the files in parallel, but still process them sequentially.
<script src="https://cdn.shopify.com/shopifycloud/app-bridge.js"></script>
<script defer src="https://static.example.app/js/runtime.73a9860c.js"></script>
<script defer src="https://static.example.app/js/vendors.39160078.js"></script>
You might be tempted to add defer to app-bridge.js too but this won’t work. The App Bridge has a check to make sure it’s loaded first and without the defer attribute.
Make sure you have the correct Content-Type headers set
This should happen automatically but it’s good to double-check that the Content-Type of your static files is correct. For Javascript files it should be application/javascript and for CSS files it should be text/css.
We had a small issue where Javascript files were being uploaded with the mime-type text/javascript and weren’t always being compressed.
AJAX Requests
A lot of the optimizations here are similar to what we did for the initial page load. You’ll want to profile your backend and see where queries or HTTP requests are slowing things down.
Make sure you’re using HTTP/2
When your browser first connects to a web server it takes some time to set up the initial SSL connection. We noticed that when our app started making AJAX requests in the Shopify admin, the browser was creating a second connection to our web server, adding another 200-300 ms to the page load.
We were serving the pages over HTTP/1.1 but were including the Connection: keep-alive header. This should have instructed the browser to keep the connection open but it seemed the fact it was in an iframe didn’t keep the connection open. The easiest fix for this was to upgrade our web server to also server pages over HTTP/2.
In general HTTP/2 is a good idea because of its multiplexing and we really should have added this earlier.
Monitoring and Next Steps
It took us several weeks of iterating to find and solve all these issues. Part of the delay is just due to the fact that LCP relies on actual user data; we’d make a change one day, have to wait one day, and then we could see the LCP results in the Shopify Partner Dashboard the next day.
Hopefully this list of things we found can help you iterate through their LCP issues more quickly. If you have any questions feel free to reach out on Twitter.

